|
2004 United States House of Representatives elections in Tennessee
2004 United States House of Representatives elections in Tennessee|
|
|
| Turnout | 66.32%  [1] 15.92 pp [1] 15.92 pp |
|---|
|
|
Majority party
|
Minority party
|
|
|
|
|
| Party
|
Democratic
|
Republican
|
| Last election
|
5
|
4
|
| Seats won
|
5
|
4
|
| Seat change
|

|

|
| Popular vote
|
1,031,959
|
1,160,821
|
| Percentage
|
46.51%
|
52.32%
|
| Swing
|
 0.20% 0.20%
|
 1.94% 1.94%
|
|
![]() Results by party winners Results by party winners Results by district margin Results by district margin Democratic hold Republican hold
|
Democratic
50–60%
60–70%
70–80%
80–90%
|
Republican
60–70%
70–80%
>90%
| |
The 2004 congressional elections in Tennessee was held on November 2, 2004, to determine who will represent the state of Tennessee in the United States House of Representatives.
Following the 2004 elections, no seats changed hands, leaving the Tennessee delegation at a 5-4 Democratic majority.[2][3]
Overview
| United States House of Representatives elections in Tennessee, 2004[4]
|
| Party
|
Votes
|
Percentage
|
Seats
|
+/–
|
|
|
Democratic
|
1,031,959
|
46.51%
|
5
|
—
|
|
|
Republican
|
1,160,821
|
52.32%
|
4
|
—
|
|
|
Independents
|
25,686
|
1.16%
|
0
|
—
|
| Totals
|
2,218,738
|
100.00%
|
9
|
—
|
(There was 272 Write-in votes that were added to the statewide total number of votes).
| Popular vote |
|---|
|
|
|
| Republican |
|
52.32% |
| Democratic |
|
46.51% |
| Other |
|
1.17% |
|
| House seats |
|---|
|
|
|
| Democratic |
|
55.56% |
| Republican |
|
44.44% |
|
By district
District 1

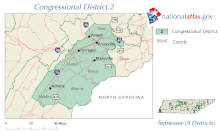
District 2

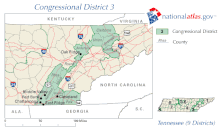
District 3

District 4

District 5

District 6

District 7

District 8

District 9

See also
References
|
|---|
U.S.
Senate | |
|---|
U.S.
House
(election
ratings) | |
|---|
| Governors | |
|---|
| State Attorneys General | |
|---|
| State officials | |
|---|
State
legislatures | |
|---|
| Mayors |
- Anaheim, CA
- Anchorage, AK
- Austin, TX
- Fort Lauderdale, FL
- Irvine, CA
- Long Beach, CA
- Newark, NJ
- New Orleans, LA
- Richmond, CA
- San Bernardino, CA
- San Jose, CA
- Norfolk, VA
- Oakland, CA
- Providence, RI
- Santa Ana, CA
- Tallahassee, FL
- Tulsa, OK
- Washington, DC
|
|---|
| States | |
|---|
|
|