Chart

A pie chart showing the composition of the 38th Parliament of Canada

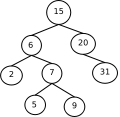
A chart (sometimes known as a graph) is a graphical representation for data visualization, in which "the data is represented by symbols, such as bars in a bar chart, lines in a line chart, or slices in a pie chart".[1] A chart can represent tabular numeric data, functions or some kinds of quality structure and provides different info.

The term "chart" as a graphical representation of data has multiple meanings:

Charts are often used to ease understanding of large quantities of data and the relationships between parts of the data. Charts can usually be read more quickly than the raw data. They are used in a wide variety of fields, and can be created by hand (often on graph paper) or by computer using a charting application. Certain types of charts are more useful for presenting a given data set than others. For example, data that presents percentages in different groups (such as "satisfied, not satisfied, unsure") are often displayed in a pie chart, but maybe more easily understood when presented in a horizontal bar chart.[2] On the other hand, data that represents numbers that change over a period of time (such as "annual revenue from 1990 to 2000") might be best shown as a line chart.

Features

A chart can take a large variety of forms. However, there are common features that provide the chart with its ability to extract meaning from data.

Typically the data in a chart is represented graphically since humans can infer meaning from pictures more quickly than from text. Thus, the text is generally used only to annotate the data.

One of the most important uses of text in a graph is the title. A graph's title usually appears above the main graphic and provides a succinct description of what the data in the graph refers to.

Dimensions in the data are often displayed on axes. If a horizontal and a vertical axis are used, they are usually referred to as the x-axis and y-axis. Each axis will have a scale, denoted by periodic graduations and usually accompanied by numerical or categorical indications. Each axis will typically also have a label displayed outside or beside it, briefly describing the dimension represented. If the scale is numerical, the label will often be suffixed with the unit of that scale in parentheses. For example, "Distance traveled (m)" is a typical x-axis label and would mean that the distance traveled, in units of meters, is related to the horizontal position of the data within the chart.

Within the graph, a grid of lines may appear to aid in the visual alignment of data. The grid can be enhanced by visually emphasizing the lines at regular or significant graduations. The emphasized lines are then called major gridlines, and the remainder is minor grid lines.

A chart's data can appear in all manner of formats and may include individual textual labels describing the datum associated with the indicated position in the chart. The data may appear as dots or shapes, connected or unconnected, and in any combination of colors and patterns. In addition, inferences or points of interest can be overlaid directly on the graph to further aid information extraction.

When the data appearing in a chart contains multiple variables, the chart may include a legend (also known as a key). A legend contains a list of the variables appearing in the chart and an example of their appearance. This information allows the data from each variable to be identified in the chart.

Types

Common charts

Four of the most common charts are:

This gallery shows:

  • A histogram consists of tabular frequencies, shown as adjacent rectangles, erected over discrete intervals (bins), with an area equal to the frequency of the observations in the interval; first introduced by Karl Pearson.[3]
  • A bar chart is a chart with rectangular bars with lengths proportional to the values that they represent. The bars can be plotted vertically or horizontally. The first known bar charts are usually attributed to Nicole Oresme, Joseph Priestley, and William Playfair.[4]
  • A pie chart shows percentage values as a slice of a pie; first introduced by William Playfair.[5]
  • A line chart is a two-dimensional scatterplot of ordered observations where the observations are connected following their order. The first known line charts are usually credited to Francis Hauksbee, Nicolaus Samuel Cruquius, Johann Heinrich Lambert and William Playfair.[6]

Other common charts are:

Less-common charts

Examples of less common charts are:

This gallery shows:

  • A bubble chart is a two-dimensional scatterplot where a third variable is represented by the size of the points.
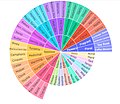
  • A polar area diagram, sometimes called a Coxcomb chart, is an enhanced form of pie chart developed by Florence Nightingale.
  • A radar chart or "spider chart" or "doi" is a two-dimensional chart of three or more quantitative variables represented on axes starting from the same point.
  • A waterfall chart also known as a "Walk" chart, is a special type of floating-column chart.
  • A tree map where the areas of the rectangles correspond to values. Other dimensions can be represented with color or hue. Smaller areas go to the bottom right corner.
  • A streamgraph, a stacked, curvilinear area graph displaced around a central axis
  • A GapChart, a time series chart showing evolving gaps and equalities between series. Other dimensions can be represented with color or hue.

Field-specific charts

Some types of charts have specific uses in a certain field

This gallery shows:

  • Stock market prices are often depicted with an open-high-low-close chart with a traditional bar chart of volume at the bottom.
  • Candlestick charts are another type of bar chart used to describe price movements of an equity over time.
  • A Kagi chart is a time-independent stock tracking chart that attempts to minimise noise.
  • Alternatively, where less detail is required, and chart size is paramount, a Sparkline may be used.

Other examples:

  • Interest rates, temperatures, etc., at the close of the period are plotted with a line chart.
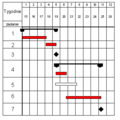
  • Project planners use a Gantt chart to show the timing of tasks as they occur over time.

Well-known named charts

Some of the better-known named charts are:

Some specific charts have become well known by effectively explaining a phenomenon or idea.

Other charts

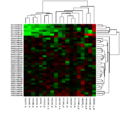
There are dozens of other types of charts. Here are some of them:

One more example: Bernal chart

Common plots

Chart software

While charts can be drawn by hand, computer software is often used to automatically produce a chart based on entered data. For examples of commonly used software tools, see List of charting software.

See also

References

  1. ^ Cary Jensen, Loy Anderson (1992). Harvard graphics 3: the complete reference. Osborne McGraw-Hill ISBN 0-07-881749-8 p.413
  2. ^ Howard Wainer (1997) Visual revelations: graphical tales of fate and Deception from Napoleon Bonaparte to Ross Perot, Lawrence Erlbaum Associates, Inc. ISBN 0-8058-3878-3 p.87-90.
  3. ^ Pearson, K. (1895). "Contributions to the Mathematical Theory of Evolution. II. Skew Variation in Homogeneous Material". Philosophical Transactions of the Royal Society A: Mathematical, Physical and Engineering Sciences. 186: 343–414. Bibcode:1895RSPTA.186..343P. doi:10.1098/rsta.1895.0010.
  4. ^ "First Ever Bar Charts Created in 14th Century". AnyChart. 2 June 2015. Retrieved 9 February 2016.
  5. ^ "History of Pie Charts". JPowered. Archived from the original on 15 January 2016. Retrieved 9 February 2016.
  6. ^ Michael Friendly (2008). "Milestones in the history of thematic cartography, statistical graphics, and data visualization" (PDF). pp. 13–14.

Further reading

Read other articles:

Daniel Toding Anggota Dewan Perwakilan RakyatMasa jabatan1 Juni 1994 – 1 Oktober 1997PresidenSoehartoGrup parlemenABRIBupati SintangMasa jabatan1984 – 27 Maret 1989GubernurSoedjimanParjoko Suryokusumo PendahuluSaleh AliPenggantiBonar Sianturi Informasi pribadiLahir12 Juni 1941 (umur 82)Rantepao, Toraja, CelebesSuami/istriAlbertinaAnak3Karier militerPihak IndonesiaDinas/cabang TNI Angkatan DaratMasa dinas1965—1997Pangkat Brigadir Jenderal TNINRP20437Satua...


Australian video game review television series This article is about the 2006–2016 Australian TV series. For the unrelated 2017 YouTube Red series, see Good Game (2017 TV series). Good GameGood Game logo (2014–2016)Created byJanet CarrJeremy RayPresented byJeremy RayMichael MakowskiSteven O'DonnellStephanie BendixsenCountry of originAustraliaOriginal languageEnglishNo. of series13No. of episodes417ProductionExecutive producerJanet CarrProducersJanet CarrEliot FishBen ShacklefordLin Jie Ko...


American college football season 2019 UConn Huskies footballConferenceAmerican Athletic ConferenceDivisionEast DivisionRecord2–10 (0–8 American)Head coachRandy Edsall (15th season)Offensive coordinatorFrank Giufre (1st season)Offensive schemeMultipleDefensive coordinatorLou Spanos (1st season)Base defense4–3Home stadiumRentschler FieldSeasons← 20182020 → 2019 American Athletic Conference football standings vte Conf Overall Team   ...

Antonio Rostagni Antonio Rostagni (Novara, 14 luglio 1903 – Padova, 5 dicembre 1988) è stato un fisico italiano. Indice 1 Biografia 2 Opere principali 3 Note 4 Bibliografia 5 Voci correlate 6 Altri progetti 7 Collegamenti esterni Biografia Laureatosi in Fisica all'Università di Torino nel 1925, subito dopo divenne assistente all'Istituto di Fisica della stessa, quando, conseguita la libera docenza in fisica sperimentale nel 1931, dopo alcuni anni di studio e di ricerca trascorsi in German...


Ираклеониты — ученики гностика Ираклеона (II век). Упоминаются как особая секта Епифанием и Августином; при крещении и миропомазании они соблюдали обряд помазания елеем и при этом произносили воззвания на арамейском языке, которые должны были освободить душу от власт�...


Anderson MesaAnderson MesaLokasi di ArizonaTitik tertinggiKetinggian7.211 ft (2.198 m)Templat:Navd88[1]Koordinat35°08′27″N 111°30′45″W / 35.14091775°N 111.512462403°W / 35.14091775; -111.512462403Koordinat: 35°08′27″N 111°30′45″W / 35.14091775°N 111.512462403°W / 35.14091775; -111.512462403 [1]GeografiLetakCounty Coconino, Arizona, Amerika SerikatGeologiJenis gunungMesa Anderson Mesa (Navaj...

この記事は検証可能な参考文献や出典が全く示されていないか、不十分です。出典を追加して記事の信頼性向上にご協力ください。(このテンプレートの使い方)出典検索?: コルク – ニュース · 書籍 · スカラー · CiNii · J-STAGE · NDL · dlib.jp · ジャパンサーチ · TWL(2017年4月) コルクを打ち抜いて作った瓶の栓 コルク(木栓、�...


Series of military conflicts between Germanic tribes and the Romans (12 BC – 16 AD) Early imperial campaigns in GermaniaPart of the Germanic WarsMap of Germania about 50 ADDate12 BC – AD 16LocationGermaniaResult A limes on the RhineBelligerents Roman Empire Germanic tribesCommanders and leaders Drusus (12–9 BC)Tiberius (8–7 BC and AD 4–5 and AD 11–12)Ahenobarbus (3–2 BC)Vinicius (2 BC to AD 4)Varus  † (AD 9)Germanicus (AD 14–16)Flavus (AD 11–12 and AD 14–16) Arm...


Cycling race 1993 La Flèche WallonneRace detailsDates14 April 1993Stages1Distance206[1] km (128.0 mi)Winning time5h 18' 00Results  Winner  Maurizio Fondriest (ITA) (Lampre–Polti)  Second  Gérard Rué (FRA) (Banesto)  Third  Davide Cassani (ITA) (Ariostea)← 1992 1994 → The 1993 La Flèche Wallonne was the 57th edition of La Flèche Wallonne cycle race and was held on 14 April 1993. The race started in Spa ...

Alfa Romeo 1900Un'Alfa Romeo 1900 SuperDescrizione generaleCostruttore Alfa Romeo Tipo principaleBerlina Altre versioniautotelaio Produzionedal 1950 al 1959 Sostituisce laAlfa Romeo 6C 2500 Sostituita daAlfa Romeo 2000 (1958) Esemplari prodotti(tutte le versioni, coupé e fuoristrada incluse) 21304[1] Altre caratteristicheDimensioni e massaLunghezza4400 mm Larghezza1600 mm Altezza1490 mm Passo2630 mm Massa1100 kg AltroAssemblaggioStabilimento del Por...


Italian football manager (born 1967) Massimiliano Allegri Allegri in 2024Personal informationFull name Massimiliano Allegri[1]Date of birth (1967-08-11) 11 August 1967 (age 56)Place of birth Livorno, ItalyHeight 1.83 m (6 ft 0 in)[2]Position(s) MidfielderSenior career*Years Team Apps (Gls)1984–1985 Cuoiopelli [it] 7 (0)1985–1988 Livorno 29 (0)1988–1989 Pisa 2 (0)1989–1990 Livorno 32 (8)1990–1991 Pavia 29 (5)1991–1993 Pescara 64 (16)...


Yeremia 2Kitab Yeremia dalam Alkitab Ibrani, MS Sassoon 1053, foto 283-315.KitabKitab YesayaKategoriNevi'imBagian Alkitab KristenPerjanjian LamaUrutan dalamKitab Kristen24← pasal 1 pasal 3 → Yeremia 2 (disingkat Yer 2) adalah bagian dari Kitab Yeremia dalam Alkitab Ibrani dan Perjanjian Lama di Alkitab Kristen. Berisi perkataan nabi Yeremia bin Hilkia, tentang Yehuda dan Yerusalem, yang hidup pada zaman raja Yosia, Yoahas, Yoyakim, Yoyakhin dan Zedekia dari Kerajaan Yehuda sekitar...

Premijer liga BiH 2017-2018BH Telecom Premijer liga 2017-2018 Competizione Premijer liga BiH Sport Calcio Edizione 18ª Organizzatore N/FSBiH Date dal 22 luglio 2017al 20 maggio 2018 Luogo  Bosnia ed Erzegovina Partecipanti 12 Formula girone unico Risultati Vincitore Zrinjski Mostar(6º titolo) Retrocessioni Borac Banja LukaNK Vitez Statistiche Miglior marcatore Miloš Filipović (16 reti) Incontri disputati 192 Gol segnati 459 (2,39 per incontro) Pubblico 342 860...


La censura cinematografica è il complesso di procedimenti attraverso il quale una autorità o un ente attuano il controllo preventivo, in itinere, o successivo alla uscita di un'opera cinematografica, limitando o negando la sua proiezione in pubblico. Indice 1 Normative nel mondo 1.1 Italia 1.2 Stati Uniti 2 Note Normative nel mondo Italia Lo stesso argomento in dettaglio: Censura cinematografica (Italia). Dalla fondazione del Regno d'Italia, lo Stato si è sempre riservato la possibilità d...


Jan Evangelista PurkyněJan Evangelista Purkyne pada tahun 1856Lahir(1787-12-17)17 Desember 1787Libochovice, Bohemia, Monarki AustriaMeninggal28 Juli 1869(1869-07-28) (umur 81)Praha, Austria-HungariaKebangsaanCekoWarga negaraAustriaAlmamaterUniversitas PrahaDikenal atasSel PurkinjeKarier ilmiahBidangAnatomi, fisiologiInstitusiUniversitas Breslau Jan Evangelista Purkyně (atau Johannes Evangelists Purkinje, dengarkanⓘ) (17 Desember 1787 – 28 Juli 1869) adalah seorang ah...

Administrative divisions of the state organisation of the Ottoman Empire Vilayets and Sanjaks of the Ottoman Empire in 1875 The administrative divisions of the Ottoman Empire were administrative divisions of the state organisation of the Ottoman Empire. Outside this system were various types of vassal and tributary states. The Ottoman Empire was first subdivided into provinces, in the sense of fixed territorial units with governors appointed by the sultan, in the late 14th century.[1]...


Eine Geodätische Kuppel von Richard Buckminster Fuller, die Biosphère, Ile Ste-Hélène, Montreal. Kuppelgewächshaus im Botanischen Garten Düsseldorf Geodätische Kuppel von Richard Buckminster Fuller aus dem Jahre 1978, Detroit, aufgestellt 2000 auf dem Vitra Campus in Weil am Rhein Geodätische Kuppel Spaceship Earth, Wahrzeichen von Epcot im Vergnügungspark Walt Disney World Resort, Florida. Geodätische Kuppeln sind Konstruktionen von sphärischen Kuppeln mit einer Gitterschale aus D...


List of states in the Holy Roman Empire A B C D E F G H I J K L M N O P Q R S T U V W X Y Z Free Imperial Cities, Imperial abbeys, Imperial Knights, Imperial Villages This is a list of states in the Holy Roman Empire beginning with the letter I: Name Type Imperial circle Imperial diet History Inner Austria Duchy 1379: Partitioned from Austria1406: Annexed to Austria Irsee Abbacy Swab SP 1186: Formed1695: Imperial immediacy1802: To Bavaria Isenberg-Limburg County n/a n/a 1253: Renamed from Al...

Fictional character Yotsuba KoiwaiYotsuba&! characterYotsuba, as drawn by Kiyohiko Azuma for a cover of the first manga tankōbon volumeFirst appearanceTry! Try! Try! (1998)Created byKiyohiko AzumaIn-universe informationRelativesYousuke Koiwai (adoptive father) Yotsuba Koiwai (小岩井よつば, Koiwai Yotsuba), also known as just Yotsuba (よつば), is a fictional character and the main protagonist in the comedy manga series Yotsuba&!, as well as the one-shot manga Try! Try! Try!,...


Thermitreaktion Eine chemische Reaktion ist ein Vorgang, bei dem eine oder meist mehrere chemische Verbindungen in andere umgewandelt werden und Energie freigesetzt oder aufgenommen wird. Auch Elemente können an Reaktionen beteiligt sein. Chemische Reaktionen sind in der Regel mit Veränderungen der chemischen Bindungen in Molekülen oder Kristallen verbunden. Durch eine chemische Reaktion können sich die Eigenschaften der Produkte im Vergleich zu den Edukten stark ändern. Nicht zu den che...