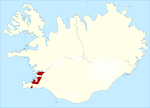
| Southwest |
|---|
|
|
 Location of Southwest within Iceland |
| Municipality | |
|---|
| Region | Capital |
|---|
| Population | 105,194 (2022)[1] |
|---|
| Electorate | 73,699 (2021) |
|---|
| Area | 802 km2 (2018)[2] |
|---|
|
| Created | 1959 |
|---|
| Seats |
- 11 (2013–present)
- 10 (2007–2013)
- 9 (1987–2007)
- 5 (1959–1987)
|
|---|
| Member of the Althing[3] | |
|---|
| Created from | |
|---|
Southwest (Icelandic: Suðvestur) is a constituency of Iceland. It was created in 1959.
Election results
| Party |
Votes |
% |
Seats
|
| Con. |
Com. |
Tot.
|
|
Independence Party |
D |
17,727 |
30.25% |
4 |
0 |
4
|
|
Progressive Party |
B |
8,520 |
14.54% |
2 |
0 |
2
|
|
Left-Green Movement |
V |
7,087 |
12.09% |
1 |
0 |
1
|
|
Reform Party |
C |
6,684 |
11.40% |
1 |
1 |
2
|
|
Pirate Party |
P |
4,853 |
8.28% |
1 |
1 |
2
|
|
Social Democratic Alliance |
S |
4,748 |
8.10% |
1 |
0 |
1
|
|
People's Party |
F |
4,436 |
7.57% |
1 |
0 |
1
|
|
Centre Party |
M |
2,612 |
4.46% |
0 |
0 |
0
|
|
Icelandic Socialist Party |
J |
1,738 |
2.97% |
0 |
0 |
0
|
|
Liberal Democratic Party |
O |
203 |
0.35% |
0 |
0 |
0
|
| Valid Votes |
58,608 |
100.00% |
11 |
2 |
13
|
| Blank Votes |
1,095 |
1.83% |
|
|
|
| Rejected Votes – Other |
117 |
0.20% |
|
|
|
| Total Polled |
59,820 |
81.17% |
|
|
|
| Registered Electors |
73,699 |
|
|
|
|
References