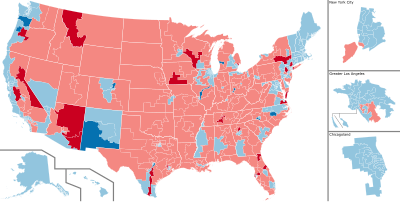
2022 United States House of Representatives elections

2022 United States House of Representatives elections

← 2020 November 8, 2022 2024 →

All 435 seats in the United States House of Representatives[a]
218 seats needed for a majority
  Majority party Minority party
 
Leader Kevin McCarthy Nancy Pelosi
Party Republican Democratic
Leader's seat California 20th California 11th
Last election 213 seats, 47.2% 222 seats, 50.3%
Seats before 212 220
Seats won 222
(+ AS + G)
213
(+ DC + NM + VI)
Seat change Increase 9
(+ G)
Decrease 9
Popular vote 54,506,136 51,477,313
Percentage 50.6% 47.8%
Swing Increase 3.4% Decrease 2.5%

Results
     Democratic gain      Republican gain
     Democratic hold      Republican hold

Speaker before election

Nancy Pelosi
Democratic

Elected Speaker

Kevin McCarthy
Republican

The 2022 United States House of Representatives elections were held on November 8 2022 to elect the United States House of Representatives. It was part of the 2022 United States elections.

The Republican Party gained control of the House from the Democratic Party. Republican Kevin McCarthy replaced Democratic Nancy Pelosi as Speaker.

Results

Federal

222 213
Republican Democratic
Parties Popular vote Seats
Vote % Change 2020 2022 +/− Strength +/−
  Republican Party 54,227,992 50.0% +2.8% 213 222 Increase 9 51.0% +2.0%
  Democratic Party 51,280,463 47.3% –3.0% 222 213 Decrease 9 49.0% –2.0%
  Libertarian Party 724,264 0.7%
  Independent 515,322 0.5% +0.2%
  Green Party 69,802 0.1%
  Constitution Party 29,886 0.0% –0.1%
  Other parties 1,481,822 1.4% +0.1%
  Write-ins 113,836 0.1%
Totals 108,443,387 100.0% 435 435 Steady 100.0%
Source: [1] Election Statistics – Office of the Clerk

By state

State Total
seats
Republican Democratic
Seats Change Seats Change
Alabama 7 6 Steady 1 Steady
Alaska 1 0 Decrease 1 1 Increase 1
Arizona 9 6 Increase 2 3 Decrease 2
Arkansas 4 4 Steady 0 Steady
California 52 12 Increase 1 40 Decrease 2
Colorado 8 3 Steady 5 Increase 1
Connecticut 5 0 Steady 5 Steady
Delaware 1 0 Steady 1 Steady
Florida 28 20 Increase 4 8 Decrease 3
Georgia 14 9 Increase 1 5 Decrease 1
Hawaii 2 0 Steady 2 Steady
Idaho 2 2 Steady 0 Steady
Illinois 17 3 Decrease 2 14 Increase 1
Indiana 9 7 Steady 2 Steady
Iowa 4 4 Increase 1 0 Decrease 1
Kansas 4 3 Steady 1 Steady
Kentucky 6 5 Steady 1 Steady
Louisiana 6 5 Steady 1 Steady
Maine 2 0 Steady 2 Steady
Maryland 8 1 Steady 7 Steady
Massachusetts 9 0 Steady 9 Steady
Michigan 13 6 Decrease 1 7 Steady
Minnesota 8 4 Steady 4 Steady
Mississippi 4 3 Steady 1 Steady
Missouri 8 6 Steady 2 Steady
Montana 2 2 Increase 1 0 Steady
Nebraska 3 3 Steady 0 Steady
Nevada 4 1 Steady 3 Steady
New Hampshire 2 0 Steady 2 Steady
New Jersey 12 3 Increase 1 9 Decrease 1
New Mexico 3 0 Decrease 1 3 Increase 1
New York 26 11 Increase 3 15 Decrease 4
North Carolina 14 7 Decrease 1 7 Increase 2
North Dakota 1 1 Steady 0 Steady
Ohio 15 10 Decrease 2 5 Increase 1
Oklahoma 5 5 Steady 0 Steady
Oregon 6 2 Increase 1 4 Steady
Pennsylvania 17 8 Decrease 1 9 Steady
Rhode Island 2 0 Steady 2 Steady
South Carolina 7 6 Steady 1 Steady
South Dakota 1 1 Steady 0 Steady
Tennessee 9 8 Increase 1 1 Decrease 1
Texas 38 25 Increase 2 13 Steady
Utah 4 4 Steady 0 Steady
Vermont 1 0 Steady 1 Steady
Virginia 11 5 Increase 1 6 Decrease 1
Washington 10 2 Decrease 1 8 Increase 1
West Virginia 2 2 Decrease 1 0 Steady
Wisconsin 8 6 Increase 1 2 Decrease 1
Wyoming 1 1 Steady 0 Steady
Total 435 222 Increase 9 213 Decrease 9

Maps

Notes

  1. Also included are five non-voting delegates.