Statistical patterns
The Westgard rules are a set of statistical patterns, each being unlikely to occur by random variability, thereby raising a suspicion of faulty accuracy or precision of the measurement system. They are used for laboratory quality control, in "runs" consisting of measurements of multiple samples. They are a set of modified Western Electric rules, developed by James Westgard and provided in his books and seminars on quality control.[1] They are plotted on Levey–Jennings charts, wherein the X-axis shows each individual sample, and the Y-axis shows how much each one differs from the mean in terms of standard deviation (SD). The rules are:[2]
| Rule |
Criteria |
Suspected |
Example
|
| 12s
|
One measurement exceeds 2 standard deviations either above or below the mean of the reference range.
|
Inaccuracy and/or imprecision
|
![]()
|
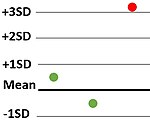
| 13s
|
One measurement exceeds 3 standard deviations either above or below the mean of the reference range.
|
Inaccuracy and/or imprecision
|

|
| 22s
|
2 consecutive measurements exceed 2 standard deviations of the reference range, and on the same side of the mean.
|
Inaccuracy and/or imprecision
|

|
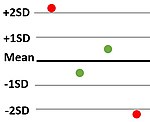
| R4s
|
Two measurements in the same run have a 4 standard deviation difference (such as one exceeding 2 standard deviations above the mean, and another exceeding 2 standard deviations below the mean).
|
Imprecision.
|

|
| 41s
|
4 consecutive measurements exceed 1 standard deviation on the same side of the mean.
|
Inaccuracy.
|

|
| 10x
|
10 consecutive measurements are on the same side of the mean.
|
Inaccuracy.
|

|
The recommended consequences when any of the above patterns occur is to reject the run, except for the rule of 12s (top in table), which serves as a warning and a recommendation of careful inspection of the data.[2]
See also
References
External links