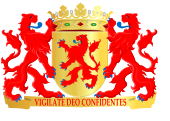
Provincial council in South Holland, Netherlands
Provincial Council of
South Holland
Provinciale Staten van
Zuid-Holland |
|---|
 |
|
| Type | |
|---|
|
President | |
|---|
Secretary | Eric Meurs |
|---|
|
| Seats | 55 |
|---|
Political groups | Government (29)
Opposition (26)
|
|---|
|
Last election | 15 March 2023 |
|---|
|
![]() |
| Meeting place of the Provincial Council of South Holland in The Hague |
|
| staten.zuid-holland.nl |
The Provincial Council of South Holland (Dutch: Provinciale Staten van Zuid-Holland), also known as the States of South Holland, is the provincial council of South Holland, Netherlands. It forms the legislative body of the province. Its 55 seats are distributed every four years in provincial elections.
History
Before the establishment of South Holland as a province, the southern part of Holland was represented in the States of Holland by 50 of its 90 members. The States of South Holland were instituted in 1840, when the province of Holland was split in two and the province of South Holland was established. The composition of the States was determined in Royal Decrees published on 9 and 11 November, and its members were first assembled on 15 December 1840. The States comprised 10 members representing the province's aristocracy, 41 members elected by city councils, and 35 member elected by municipal councils of rural areas, making for a total of 86 members. Among the cities were Rotterdam (represented by ten members), The Hague (eight), Leiden (five), Dordrecht (four), Delft (three), Gorinchem, Gouda, Schiedam (two each), Brielle, Maassluis, Schoonhoven, Vlaardingen and Woerden (one each). All rural districts were represented by two members, except for the district of Meerkerk, which was represented by three. All members were elected to six-year terms, with a third of the seats up for election every two years. Elections were held on 1 June, while the newly elected members took office exactly a month later, on 1 July.[1] In this period, the States of South Holland were responsible for electing the province's 12 members of the 58-member House of Representatives.[2]
This composition was retained until 1850, two years after the Constitutional Reform of 1848, when the Provincial Act of Minister of the Interior Johan Rudolph Thorbecke introduced direct elections to the Provincial States. The States were now composed of 80 members elected directly in electoral districts, serving six-year terms, with half of the seats up for election every three years. New members still took office on 1 July, but elections were now held on the second Tuesday in May, while by-elections had to be scheduled no later than two months after the seat in question became vacant. The first direct election was held in 1852; in a transitional arrangement, the members were elected in thirteen electoral districts, each of which elected six or seven seats using a majoritarian electoral systems. In 1853, the province was definitively divided into seventeen districts, ranging in size from three to thirteen seats.[1] Two additional seats were added in 1897, bringing the total to 82. In this period, the States were responsible for electing the province's members of the Senate.[2]
Since 1919, the States of South Holland have been elected using party-list proportional representation in one province-wide district. In that year, terms were cut to four years, with all seats up for election at once every four years. The States were temporarily dissolved during the German occupation of the Netherlands, starting in the summer of 1941.[2] Prominent members of the States of South Holland have included Suze Groeneweg, Dirk Jan de Geer and Pieter Oud.
Current composition
Since the 2023 provincial elections, the distribution of seats of the Provincial Council of South Holland has been as follows:
|
|---|
| Party | Votes | % | +/– | Seats | +/– |
|---|
| Farmer–Citizen Movement | 203,417 | 13.67 | New | 8 | New |
| People's Party for Freedom and Democracy | 195,478 | 13.14 | –2.52 | 8 | –2 |
| GroenLinks | 145,904 | 9.81 | +0.75 | 6 | +1 |
| Democrats 66 | 112,097 | 7.53 | –1.00 | 4 | –1 |
| Labour Party | 103,896 | 6.98 | –0.84 | 4 | 0 |
| Party for Freedom | 95,062 | 6.39 | –0.61 | 4 | 0 |
| Christian Democratic Appeal | 92,531 | 6.22 | –1.52 | 4 | 0 |
| JA21 | 91,113 | 6.12 | New | 4 | New |
| Party for the Animals | 72,664 | 4.88 | +0.51 | 3 | +1 |
| Reformed Political Party | 61,514 | 4.13 | +0.23 | 2 | 0 |
| Christian Union | 61,283 | 4.12 | –1.45 | 2 | –1 |
| Forum for Democracy | 53,067 | 3.57 | –13.86 | 2 | –9 |
| Socialist Party | 50,616 | 3.40 | –0.72 | 2 | 0 |
| 50PLUS | 45,186 | 3.04 | –1.41 | 1 | –1 |
| Volt | 42,652 | 2.87 | New | 1 | New |
| DENK | 22,068 | 1.48 | –1.25 | 0 | –1 |
| BVNL | 18,341 | 1.23 | New | 0 | New |
| General Water Board Party | 13,797 | 0.93 | New | 0 | New |
| GOLD | 6,105 | 0.41 | New | 0 | New |
| Jesus Lives | 1,123 | 0.08 | +0.03 | 0 | 0 |
| Total | 1,487,914 | 100.00 | – | 55 | – |
|
| Valid votes | 1,487,914 | 99.33 | |
|---|
| Invalid votes | 4,682 | 0.31 | |
|---|
| Blank votes | 5,398 | 0.36 | |
|---|
| Total votes | 1,497,994 | 100.00 | |
|---|
| Registered voters/turnout | 2,747,402 | 54.52 | +0.03 | |
|---|
| Source: Kiesraad |
See also
References
External links