|
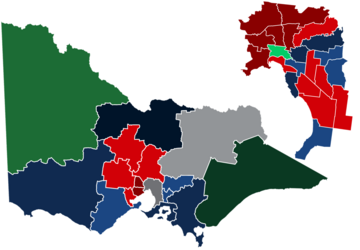
Results of the 2013 Australian federal election in Victoria
2013 Australian federal election
(Victoria)|
|
|
|
|
![]() Winning Party by Electorate
Winning Party by Electorate  First Preference Vote
  Two-Candidate Preferred Vote
 |
This is a list of electoral division results for the Australian 2013 federal election in the state of Victoria.[1]
Overall result
| Party
|
Votes
|
%
|
Swing
|
Seats
|
Change
|
| Liberal/National Coalition
|
|
|
|
Liberal Party of Australia
|
1,320,417
|
40.08
|
+3.63
|
14
|
 2 2
|
|
|
National Party of Australia
|
86,045
|
2.61
|
–0.58
|
2
|

|
| Coalition total
|
1,436,933
|
42.69
|
+3.05
|
16
|
 2 2
|
|
|
Australian Labor Party
|
1,146,894
|
34.81
|
–8.00
|
19
|
 3 3
|
|
|
Australian Greens
|
355,698
|
10.80
|
–1.86
|
1
|

|
|
|
Palmer United Party
|
119,623
|
3.63
|
+3.63
|
|
|
|
|
Australian Sex Party
|
67,460
|
2.05
|
+1.86
|
|
|
|
|
Family First Party
|
59,288
|
1.80
|
–1.34
|
|
|
|
|
Rise Up Australia Party
|
18,124
|
0.55
|
+0.55
|
|
|
|
|
Democratic Labour Party
|
16,714
|
0.51
|
+0.51
|
|
|
|
|
Australian Christians
|
15,886
|
0.48
|
+0.48
|
|
|
|
|
Katter's Australian Party
|
15,409
|
0.47
|
+0.47
|
|
|
|
|
Liberal Democratic Party
|
4,716
|
0.14
|
–0.11
|
|
|
|
|
Country Alliance
|
4,708
|
0.14
|
+0.14
|
|
|
|
|
Animal Justice Party
|
1,878
|
0.06
|
+0.06
|
|
|
|
|
Bullet Train for Australia
|
1,772
|
0.05
|
+0.05
|
|
|
|
|
Socialist Alliance
|
1,703
|
0.05
|
–0.02
|
|
|
|
|
Australian Stable Population Party
|
856
|
0.03
|
+0.03
|
|
|
|
|
Secular Party of Australia
|
776
|
0.02
|
–0.14
|
|
|
|
|
Citizens Electoral Council
|
557
|
0.03
|
−0.01
|
|
|
|
|
Non-Custodial Parents Party
|
215
|
0.01
|
+0.01
|
|
|
|
|
Australia First Party
|
212
|
0.01
|
+0.00
|
|
|
|
|
Senator Online
|
209
|
0.01
|
+0.01
|
|
|
|
|
Australian Independents
|
170
|
0.01
|
+0.01
|
|
|
|
|
Australian Protectionist Party
|
156
|
0.00
|
+0.00
|
|
|
|
|
Independents
|
53,307
|
1.62
|
+0.79
|
1
|
 1 1
|
|
|
Non Affiliated
|
1,886
|
0.06
|
+0.04
|
|
|
| Total
|
3,294,659
|
|
|
37
|
|
| Two-party-preferred vote
|
|
|
Australian Labor Party
|
1,653,977
|
50.20
|
−5.11
|
19
|
 3 3
|
|
|
Liberal/National Coalition
|
1,640,682
|
49.80
|
+5.11
|
16
|
 2 2
|
 Electoral divisions: Victoria Electoral divisions: Victoria
 Electoral divisions: Melbourne area Electoral divisions: Melbourne area
Results by division
Aston
Ballarat
Batman
Bendigo
Bruce
Calwell
Casey
Chisholm
Corangamite
Corio
Deakin
Dunkley
Flinders
Gellibrand
Gippsland
Goldstein
Gorton
Higgins
Holt
Hotham
Indi
Isaacs
Jagajaga
Kooyong
La Trobe
Lalor
Mallee
Maribyrnong
McEwen
McMillan
Melbourne
Melbourne Ports
Menzies
Murray
Scullin
Wannon
Wills
References
- ^ "2013 Federal Election Results for Victoria by Division". AEC.
- ^ 2013 results for Aston, AEC.
- ^ 2013 results for Ballarat, AEC.
- ^ 2013 results for Batman, AEC.
- ^ 2013 results for Bendigo, AEC.
- ^ 2013 results for Bruce, AEC.
- ^ 2013 results for Calwell, AEC.
- ^ 2013 results for Casey, AEC.
- ^ 2013 results for Chisholm, AEC.
- ^ 2013 results for Corangamite, AEC.
- ^ 2013 results for Corio, AEC.
- ^ 2013 results for Deakin, AEC.
- ^ 2013 results for Dunkley, AEC.
- ^ 2013 results for Flinders, AEC.
- ^ 2013 results for Gellibrand, AEC.
- ^ 2013 results for Gippsland, AEC.
- ^ 2013 results for Goldstein, AEC.
- ^ 2013 results for Gorton, AEC.
- ^ 2013 results for Higgins, AEC.
- ^ 2013 results for Holt, AEC.
- ^ 2013 results for Hotham, AEC.
- ^ 2013 results for Indi, AEC.
- ^ 2013 results for Isaacs, AEC.
- ^ 2013 results for Jagajaga, AEC.
- ^ 2013 results for Kooyong, AEC.
- ^ 2013 results for La Trobe, AEC.
- ^ 2013 results for Lalor, AEC.
- ^ 2013 results for Mallee, AEC.
- ^ 2013 results for Maribyrnong, AEC.
- ^ 2013 results for McEwen, AEC.
- ^ 2013 results for McMillan, AEC.
- ^ 2013 results for Melbourne, AEC.
- ^ 2013 results for Melbourne Ports, AEC.
- ^ 2013 results for Menzies, AEC.
- ^ 2013 results for Murray, AEC.
- ^ 2013 results for Scullin, AEC.
- ^ 2013 results for Wannon, AEC.
- ^ 2013 results for Wills, AEC.
See also
|
|