1882 Canadian federal election|
|
|
|
| Turnout | 70.3%[1] ( 1.2pp) 1.2pp) |
|---|
|
|
 1882 Canadian electoral map |
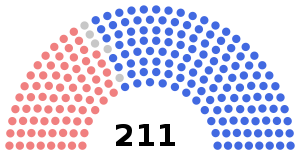
 The Canadian parliament after the 1882 election |
|
The 1882 Canadian federal election was held on June 20, 1882, to elect members of the House of Commons of Canada of the 5th Parliament of Canada.
Prime Minister Sir John A. Macdonald's Conservatives and Liberal-Conservatives retained power, defeating the Liberal Party of Edward Blake.
National results

Acclamations:
The following Members of Parliament were elected by acclamation;
- British Columbia: 2 Liberal-Conservatives
- Manitoba: 1 Conservative
- Ontario: 2 Conservatives
- Quebec: 11 Conservatives, 1 Independent Conservative, 4 Liberal-Conservatives, 3 Liberals
- New Brunswick: 1 Liberal-Conservative, 1 Independent
- Nova Scotia: 1 Conservative
Results by province
| Party name
|
BC
|
MB
|
ON
|
QC
|
NB
|
NS
|
PE
|
Total
|
|
|
Conservative
|
Seats:
|
3
|
2
|
39
|
38
|
4
|
8
|
-
|
94
|
|
|
Popular vote (%):
|
38.4
|
13.6
|
27.0
|
37.7
|
25.6
|
23.0
|
17.1
|
27.8
|
|
|
Liberal-Conservative
|
Seats:
|
3
|
1
|
13
|
12
|
3
|
5
|
2
|
39
|
|
|
Vote (%):
|
15.8
|
38.9
|
9.1
|
10.4
|
7.1
|
25.8
|
25.4
|
12.6
|
|
|
Liberal
|
Seats:
|
-
|
2
|
40
|
12
|
7
|
8
|
4
|
73
|
|
|
Vote (%):
|
10.6
|
25.3
|
31.9
|
21.5
|
36.8
|
38.7
|
40.7
|
31.1
|
|
|
Independent
|
Seats:
|
|
|
-
|
-
|
1
|
-
|
|
1
|
|
|
Vote (%):
|
|
|
1.7
|
0.8
|
0.4
|
4.8
|
|
1.6
|
|
|
Nationalist Conservative
|
Seats:
|
|
|
|
1
|
|
|
|
1
|
|
|
Vote (%):
|
|
|
|
1.0
|
|
|
|
0.2
|
|
|
Independent Liberal
|
Seats:
|
|
|
-
|
1
|
1
|
|
|
2
|
|
|
Vote (%):
|
|
|
0.7
|
1.5
|
6.2
|
|
|
1.1
|
|
|
Independent Conservative
|
Seats:
|
|
|
|
1
|
|
|
|
1
|
|
|
Vote (%):
|
|
|
|
0.9
|
|
|
|
0.2
|
|
|
Unknown
|
Vote (%):
|
35.2
|
22.2
|
29.6
|
27.1
|
23.9
|
7.7
|
16.8
|
25.4
|
| Total seats
|
6
|
5
|
92
|
65
|
16
|
21
|
6
|
211
|
See also
Notes
- ^ Macdonald was also elected in Lennox; he chose to sit for Carleton instead, and resigned as the Member of Parliament for Lennox.
References